Sales pipeline visibility problems and how to fix them
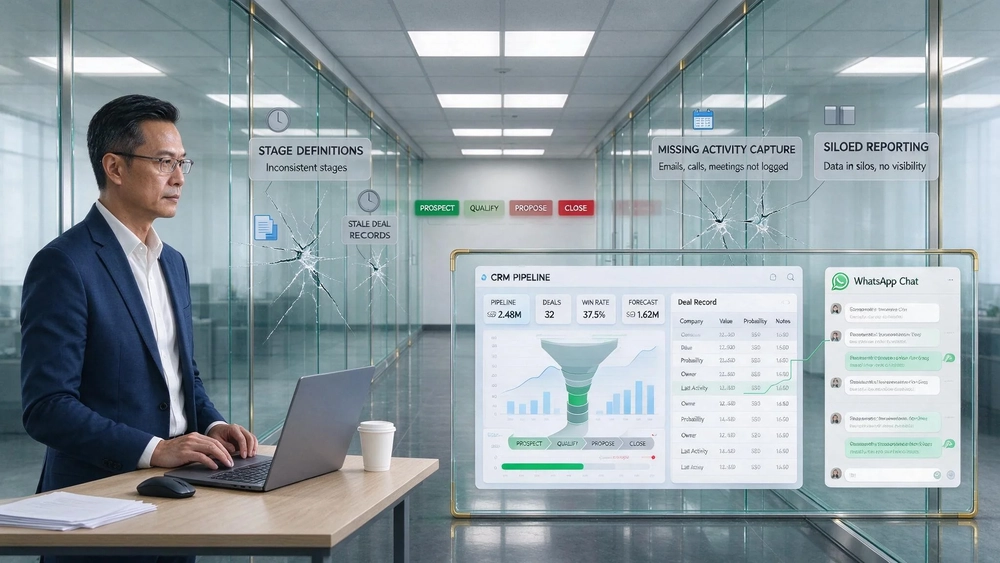
Sales pipeline visibility is the ability to see where every open deal stands, how it got there and what happens next, and it fails for four structural reasons rather than for want of more leads. Most teams respond to a short quarter by buying best lead generation spend, when the cheaper repair is what happens to those leads after they land: stage definitions, record hygiene, activity logging and one reporting source. HubSpot's 2026 State of Sales report, published on 10 November 2026, puts the problem plainly: 22% of sales leaders cite inconsistent pipeline visibility as one of their team's top operational blockers.
That number is worth holding next to the way most SME teams are built. A marketing lead buys enquiries by the month, hands them to a small sales team, and then reads a pipeline report that was filled in by people who each carry their own idea of what "proposal stage" means. The report looks healthy right up to the week the quarter closes short. This article works through the mechanism behind that gap, then gives a four-step audit, the three dashboards that make the picture usable, and the fixes that keep it accurate after the audit is done.
Key takeaways
- Visibility fails in four distinct places: stage definitions, stale records, activity capture and siloed reporting. A team usually runs two or three of them at once.
- An audit runs in a fixed order: required fields, stage consistency, activity capture, then report reconciliation. Cleaning data before agreeing definitions wastes the cleanup.
- Three dashboards carry the picture: pipeline health, forecast coverage and activity. Each one names the question it answers.
- Stage exit criteria written as observable buyer facts, not rep judgement, are what make a conversion rate comparable between reps.
- A pipeline that looks full but closes short is usually an activity problem with a reporting disguise, not a lead volume problem.
Contents
- What pipeline visibility actually measures
- Where the visibility breaks
- How to audit a pipeline that looks full but closes short
- The three dashboards that make the picture usable
- Fixing stages, hygiene and capture
- What Topkee's Leadbox system does about it
- Singapore market notes
- What to do next quarter
What pipeline visibility actually measures
The word visibility is used loosely, so it helps to fix what is being measured. A deal record has to answer four questions before a manager can act on it: which stage the buyer has genuinely reached, how long the deal has sat there, what interaction last happened and when, and when the buyer expects a decision. Stage, age, last activity and close date. When any of the four is missing or wrong, the pipeline report moves from evidence to opinion without announcing the change.
That distinction matters because a report never fails loudly. It keeps producing charts and totals, and the numbers keep adding up; it is the relationship between the numbers and the buyer's world that has drifted. HubSpot's report frames it as a difference between what reps entered and what is actually happening, and that framing is the one to carry into an audit.
HubSpot's 2026 State of Sales research also found that 21% of sales professionals named improved deal tracking and management as their top priority, ahead of AI implementation and better alignment between sales and marketing. Deal tracking outranking AI in a sales team's own ranking is a useful signal about where the work sits: the tooling question is secondary to whether the record is trustworthy.
Where the visibility breaks
Four failures account for most of the gap, and they differ in how they degrade the report. Sorting a team's problem into the right one of the four is the first useful move, because the fixes do not overlap cleanly.
| Failure | What the report shows | Typical first symptom |
|---|---|---|
| Inconsistent stage definitions | Conversion rates that measure rep interpretation | Two reps disagree on the stage of the same deal |
| Stale deal data | Deals that stay open past their close date | Close dates that pass without a decision |
| Missing activity capture | Records that go quiet while the buyer is active | Deals that look cold and close out of nowhere |
| Siloed reporting | Two teams quoting different opportunity counts | Pipeline review becomes an argument about data |
Inconsistent stage definitions
Stage definitions break when the same event means different things to different reps. One rep moves a deal to proposal when pricing goes out; another waits for the buyer to acknowledge it; a third advances anything with a follow-up booked. Each is acting in good faith, and the stage-conversion report that results measures interpretation rather than buyer progress.
The damage is quiet because it lands on individuals first. A manager comparing conversion rates across the team will coach the rep whose numbers look weaker, when that rep may simply apply a stricter definition. The team then converges on the loosest reading, and best lead generation targets get set on a number that is drifting away from what buyers did.
Stale deal data
Records go stale in ordinary ways: a close date that passed weeks ago, a deal value set during discovery and never revised, an owner who left the company, a next step that was completed and never replaced. A stale record can sit in an open-pipeline report beside active opportunities with nothing to distinguish them.
Whether a stale deal distorts the forecast depends on the filter. A report of all open deals will include a deal with an expired close date; a forecast filtered to the current quarter may exclude the same deal entirely. Two numbers, one record, no reconciliation, and no way to tell how much of the shortfall is real. HubSpot's 2026 State of Sales findings point at the same gap from the tooling side: 72% of revenue and sales leaders say their tools cannot provide the complete, accurate revenue data they need.
The same applies to a pipeline that looks full on paper: review the deal behind each record before acting on it. The review asks whether the opportunity is still active, whether the buyer's timeline moved, and what the close date should now be.
Missing activity capture
Activity capture fails when calls, emails and meetings happen outside the CRM or get logged inconsistently. The record then shows engagement that stopped and hides engagement that continued. A deal with no logged activity for three weeks may be genuinely cold, or it may be the most active opportunity on the board, worked over a channel nobody is tracking.
There is a second layer that managers often miss: logged activity is not the same as buyer engagement. A CRM can show a full outreach sequence against a prospect who stopped replying. The count of touches tells you what the rep did; replies, meetings and other engagement signals tell you whether the buyer is moving. The two counts have to be read together, and a team that only watches the first will mistake a long sequence for a live deal.
Siloed reporting
Siloed reporting is when pipeline data sits in one system, marketing attribution in another and customer history in a third, so no single view holds the full deal context. The visible cost is reconciliation work. HubSpot's reporting on its 2026 State of Sales research found that 43% of teams spend six to ten hours per month reconciling revenue data, roughly one full business day.
The hidden cost is the disputed number. When the sales report and the marketing report disagree on how many opportunities a campaign produced, the pipeline review turns into an argument about whose data is correct, and the deals that needed discussing go unmentioned.

How to audit a pipeline that looks full but closes short
Gap filled: g1
The brief behind this article set out to close a specific hole: the search results that surround this topic are tool lists and lead-generation strategy pages, and almost none of them describe how to inspect a pipeline that looks healthy and is not. The audit below is that inspection, in the order that avoids wasted work. Each step produces a finding worth recording so the next audit has a baseline to compare against.
Step 1: Inventory the fields a forecast depends on
Pull every open deal and check field completeness: company, contact, value, close date, owner, source. The share of records missing a field a forecast needs is the first honest number about the pipeline, and it is usually a larger share than the team expects. Filter for elapsed close dates in the same pass and review each one rather than deleting it.
Step 2: Test stage definitions against real deals
Definitions get tested by application, not by reading the documentation. Take five to ten anonymised deals and have three reps assign each one a stage independently, without discussion. Where the three disagree, the written exit criteria are either missing or weasel-worded, and the stage-conversion report is measuring opinion.
This step also exposes a common gap in Singapore SMEs: stage names exist in the CRM because a template supplied them, but nobody wrote down what moves a deal from one stage to the next. Reps then infer the rule from how the manager reacts in reviews, which is a rule nobody can audit.
Step 3: Measure activity capture against what happened
Establish a baseline by checking the share of open deals with any logged activity in the past 14 days. Then spot-check a handful of those deals against the rep's calendar and sent mail. The comparison separates the two cases that look identical in a pipeline view: a deal with no logged work because nothing happened, and a deal with no logged work because the work happened somewhere the CRM never saw.
Check which integrations are actually active in the same pass. An email or calling tool that is not connected to the CRM leaves real interactions out of the deal record, and the fix is a configuration change rather than a discipline talk.
Step 4: Trace each pipeline report to one source
Take two reports that answer the same question and compare them. If the totals differ, check the date range, the deal-type filter, the definition of an opportunity and the underlying data source before touching any records. Record the discrepancy and its cause. Definitions come before data cleanup; a report built on a different definition will keep disagreeing no matter how clean the records get.
The three dashboards that make the picture usable
Once the audit has produced findings, three dashboards carry most of what a sales leader needs. Each answers one question, and none of them substitutes for the others.
| Dashboard | Question it answers | What a problem looks like |
|---|---|---|
| Pipeline health | What is in the pipeline, and how is it shaped? | 70% of the value in one late stage; earliest stage empty |
| Forecast coverage | Will the open pipeline support the target? | Coverage thin, close dates repeatedly pushed |
| Activity | What is happening inside each deal? | Open deals with no recent logged activity |
The pipeline health dashboard shows the shape of the pipeline. A manager reading it looks for distribution problems, such as a pipeline where 70% of the value sits in one late stage, or one where the earliest stage has been empty for a month. A team that cannot get more leads for my business enquiries into the early stages will show the first shape. Either shape suggests the pipeline is being fed late or is not being fed at all, and the two need different responses.
The forecast dashboard compares expected revenue against targets and shows how much qualified pipeline supports the expectation. Coverage has to be read alongside stage conversion, win rate and deal aging, because coverage built on loose stages is a comfortable number. Close-date changes belong on this dashboard too; repeated slippage is a signal the forecast leans on deals that will not close when the report says they will. Stage probabilities in a CRM multiply whatever stage a rep assigned, so inconsistent assignment distorts the weighted pipeline directly.
The activity dashboard answers the question the other two raise: whether a stalled deal reflects a stalled buyer or a rep who moved on. It shows what reps are doing inside deals and where the last interaction sits against the stage and the next step. It is also the dashboard that catches missing capture as distinct from missing effort.
Weekly reviews should track five metrics on these dashboards: stage conversion rate, pipeline velocity, stalled deals, aging deals and forecast coverage. Stalled deals are open opportunities with no logged activity or stage movement within a defined period, such as 14 or 30 days. Aging deals are the separate case where activity is recent but progress is slower than comparable deals took. Weekly monitoring catches movement, while longer periods give the trend context.

Fixing stages, hygiene and capture
The audit identifies; these three practices repair, and they reinforce each other. A team reading this section should pick the repair that matches its audit finding rather than running all three at once; a team running all three ends up changing definitions mid-measurement, which is how the next get more leads for my business campaign ends up attributed to a stage that means something new.
Write exit criteria as buyer facts
An exit criterion is the specific condition a deal must meet before it moves on, written as something observable. "Budget confirmed by the economic buyer" is one. "Prospect seems interested" is not, because two reps will reach different conclusions from the same call. Three to five criteria per stage is a reasonable starting point, adjusted to the length of the sales cycle.
The test of an exit criterion is whether a manager can check it against the record. If the criterion cannot be verified from something a buyer said or did, it belongs in the rep's call notes, not in the stage definition. Stages built on internal sales activity rather than buyer progress are a common design error, and they produce exactly the optimism that hides a thin pipeline.
Set a weekly hygiene routine
Deal hygiene is the routine of keeping open records current, and a weekly pass over open deals surfaces outdated information before it accumulates into a quarterly cleanup. Close dates, values, next steps and owners are the four fields worth checking every week; each has a natural failure mode and each distorts a different report.
Connect what can be connected. Email, calendar and calling integrations reduce manual logging, but what the CRM captures depends on the integration and the account settings, so the team has to know which interactions log automatically and which still need a manual entry. Where a channel will always need manual logging, that expectation belongs in the weekly routine rather than in a general instruction to log everything.
Automate the follow-up, not the judgement
Rule-based workflows can move deals when defined conditions are met, assign follow-up tasks, notify owners about elapsed close dates and flag deals without recent activity. That work is administrative and repetitive, which makes it a good candidate for automation.
Automation cannot tell you why a deal stalled. A workflow can flag a deal with no recent activity, but someone still has to check whether the budget changed, the champion left or a competitor entered. Watch out for the pattern where a sequence keeps firing at a prospect who has stopped replying; the CRM shows healthy activity and the buyer has already gone quiet. The count of outbound touches is not a measure of engagement.
What Topkee's Leadbox system does about it
The four failures above each need a system that keeps one record from capture to close. Topkee's Leadbox is the lead and deal management layer of the Topkee system, and its structure maps onto the repairs this article describes. The pipeline in Leadbox runs from lead discovered to deal won as default stages, with custom event labels per stage, and the sales hub module sets a five-stage pipeline (lead prospecting, needs validation, solution matching, quotation, closing) that a team can adjust by drag and drop without a developer.
The stage side is handled by event feedback rather than a current-state field. Every stage change triggers an event tagged to the lead's unique ttoclid and returned through TTO Tag to Google Analytics, Facebook Pixel, Google Ads Conversions and Bing UET, so the sales stage and the paid-media conversion signal share one event source and one definition. That closes the silo described earlier at the point where it usually opens: the deal stage lives in the sales tool, the conversion lives in the ad platform, and nobody owns the mapping between them. Because stages can be renamed per team, the notes on this product are explicit that the stage model needs one owner, versioned changes and an event naming convention mapped to the ad platforms.
The activity side is handled by capture and by pressure. Leadbox pulls enquiries from web forms, third-party sites, WhatsApp, Messenger and call tracking into one list, consolidating company, contact, phone, email, source, message and budget, so the deal record starts with the source rather than with a recollection. Reps log calls, chats, emails and progress changes from the same list, and managers see follow-up status by rep and by stage. Two alerts do the nagging: leads with no interaction for two days get an automatic re-engagement push, and a stage-velocity alert fires when the conversion rate from quotation to closing falls well below its historical average. Both are configurable alert parameters, not measured outcomes.
The boundary is worth stating. Leadbox covers inbound capture and call-recording transcription, but outbound calls and offline meetings still depend on the rep logging them. Quick notes, dashboards and alert prompts reduce missing activity; they do not remove it. Deals that close beyond a platform's attribution window also fall out of platform reporting, which is a separate limit from pipeline visibility and should not be confused with it. For a team that decides the problem is lead volume rather than record quality, the starting point is a lead generation service built around tracked clicks and cost per lead; for a team that has decided the problem is mid-funnel drop-off, the lead tracking system is the layer that shows where enquiries stop moving.
Singapore market notes
The Singapore-specific part of this problem is structural rather than regulatory. Most SMEs here run a small sales team across several channels at once, from web forms and WhatsApp to the phone and the marketplaces, and the CRM, when there is one, was set up by whoever had time. Stages carry template names, WhatsApp conversations live on a rep's phone, and the pipeline report is assembled in a spreadsheet at month end.
Two practical adjustments follow. WhatsApp capture matters more than email capture, because it is where a large share of first contact happens; a system that does not fold chat into the deal record will always show missing activity. GST-inclusive versus GST-exclusive deal values need one convention chosen before the first audit, or the reconciliation step will surface a discrepancy that is not a data problem. A team running campaign enquiries through Google Ads and Meta should check that stage changes reach both platforms, because the attribution window differs by platform and a deal that closes late can vanish from the ad report even when the pipeline recorded it.
The rules that matter here are data protection ones. PDPC guidance on consent and notification applies to how lead data is collected and stored, and a system that consolidates WhatsApp, forms and call tracking into one record should be checked against that guidance before it is switched on, not after.

What to do next quarter
The order of work matters more than the volume of it. A team that starts with new lead volume while the four failures are unfixed buys more deals into a pipeline that will misreport them. A team that starts with the audit spends a week, produces four findings and knows which repair to do first.
For the decision between those two paths, the audit's output is the input. If step one finds a large share of records missing forecast fields, start there. If step two finds reps disagreeing on stages, write the exit criteria before anything else. If step four finds two reports disagreeing, fix the definitions before the records. Only when all four checks come back reasonably clean is the answer to get more leads for my business more lead generation, and at that point the extra enquiries land in a record that can be read.
Follow-up on stalled deals is the repair most teams postpone longest, because it feels like a conversation problem rather than a systems one. Teams deciding how to get more leads for my business usually reach this point last, after the volume questions are settled. The AI SDR guide sets out which parts of that follow-up can be handed to an agent and which stay with a person, and it is worth reading before deciding that the fix is another hire. Teams whose follow-up work is genuinely a routing problem, rather than a record problem, will also recognise the pattern described in the comparison of paid channels that feed the pipeline in the first place.
The checklist to run today, in order:
- List open deals missing any forecast field, and count them as a share of the pipeline.
- Have three reps stage five anonymised deals independently; count the disagreements.
- Check the share of open deals with activity logged in the past 14 days, then spot-check five against calendar and sent mail.
- Take two reports that answer the same question and write down why the totals differ.
- Write down the exit criteria for the stage where deals stop moving.
FAQ
Why does my pipeline look full but close short?
The usual cause is missing activity capture combined with stale close dates. Deals with no logged work stay in the report because nothing removed them, and deals that are actually progressing get worked outside the CRM. Auditing activity capture before changing forecast methodology separates the two, and the fix is usually capture plus a stalled-deal review rather than a new forecasting model.
How often should a team review stalled deals?
Weekly, because a stalled deal is defined by a period of inactivity. Open opportunities with no logged activity or stage movement within 14 or 30 days need a decision: follow up, revise the close date, or disqualify. A monthly review lets four weeks of silence pass before anyone notices, and the buyer has usually decided by then.
Is the problem our CRM or our process?
Test before replacing anything. If three reps assign different stages to the same set of deals, the problem is the definition, and a new CRM will inherit it. If the reports disagree on the same question, the problem is the definition chain. A tool change fixes neither; written exit criteria and one reporting source do.
How many exit criteria should each stage have?
Three to five is a workable starting point for most SME sales cycles, adjusted to how long the deal takes. The constraint is not the number but the form: each criterion has to be checkable against something the buyer said or did. Criteria that require a manager to interpret rep confidence are the ones that reopen the inconsistency problem.
What should a pipeline dashboard show first?
Pipeline health by stage and aging, because it reveals distribution problems before any forecast is attempted. A stage holding 70% of the value, or an earliest stage that has gone empty, is visible there. Forecast coverage and activity dashboards are added once the records behind them can be trusted.
Sources
- Jenny Bergen Clark, "Sales pipeline visibility problems (and how to fix them)", blog.hubspot.com, 2026-11-10. https://blog.hubspot.com/sales/sales-pipeline-visibility

Article Author
Pang Sir