B2B Google Ads CPC Inflation: What 14 Advertisers Paid
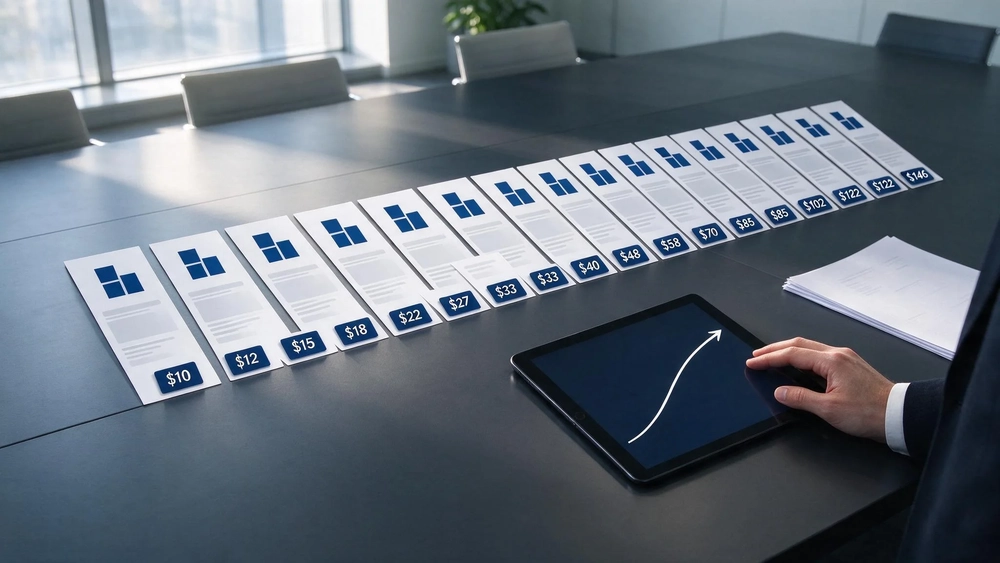
As of November 2026, the short answer is that the same B2B search click costs more, and part of the increase is self-inflicted. A study of 14 B2B advertisers tracked 1,349 non-brand Google Ads keywords over six quarters and found the same keywords cost about 21% more per click year over year once budget, position and Quality Score were held constant. If you are briefing a sem agency for a 2027 budget, the number that matters is not the headline but the split: how much of the rise is the market and how much was bought by the advertiser's own spending decisions. When you ask ppc advertising companies to justify an increase, this same-keyword split is the first thing to request.
Key takeaways
- The same non-brand keywords cost about 21% more per click in April to September 2026 than in the same months of 2025, after controls.
- Every 10% rise in campaign spend added about 1.4% to the advertiser's own CPCs on top of the market.
- Individual outcomes varied widely: the actual change ranged from a 30% decrease to a 121% increase.
- Alphabet's own reported figures moved far less, which is one reason the two measures should not be compared directly.
What the study actually measured
Grey Matter used first-party Google Ads data from its own client base, covering 14 B2B advertisers, 1,349 non-brand keywords and six quarters from April 2025 to September 2026. Year-over-year figures compare April through September 2026 with the same months of 2025, which removes the seasonality that makes one quarter look cheaper or dearer than the next.
Two design choices decide whether the result means anything. Broad match keywords were excluded, because Google can start matching a broad term to pricier searches and lift its CPC without the keyword itself changing. Campaigns running Maximize Clicks were excluded too, since their CPCs reflect how an algorithm spreads a fixed budget rather than what the auction charged.
Every advertiser carried equal weight, so the largest spender could not drive the result. Search campaigns only: Performance Max, Shopping and Display sat outside the sample.
How the market share was separated from the advertiser's own choices
The method matters more than the headline, because the gap between raw and adjusted figures is the useful part.
| Measure | Same-keyword CPC change |
|---|---|
| No controls | 29% |
| Plus budget changes | 22% |
| Plus ad position and Quality Score | 21% |
Before any adjustment, keywords bought in both years cost 29% more. Adding budget controls pulled that to 22%, and adjusting for ad position and Quality Score took it to 21%. The budget step alone removed the difference between 29% and 22%, which means advertisers' own spending decisions were inflating the apparent market increase before the correction.
A second, independent method used a chain-linked index, the same construction consumer price indexes use, matching each quarter's keywords to the next and multiplying the changes. Every method and check landed between 17% and 32%. Read together, the study concludes the same B2B click most likely costs about 20% more than a year ago. The range is real: the main estimate has a likely range of 1% to 44%, because 14 advertisers is a small sample.
The mechanism: spending more raises your own prices
The finding that should change how a plan is built is this one. Across the sample, every 10% increase in campaign spend raised an advertiser's own CPCs by about 1.4%, on top of the market movement. Doubling a budget adds roughly 11% to CPCs from that source alone.
The likely mechanism is automated bidding. A campaign on a strategy such as Maximize Conversions with a bigger budget spends it by entering auctions it previously skipped: higher positions, more competitive searches, pricier times of day. The keywords do not change. The price paid for them does.
The most extreme case makes the point. One advertiser nearly quadrupled its non-brand Search spend year over year, and the same non-brand keywords cost it 132% more. Its brand keywords, held on a flat budget, rose about 4% in the third quarter. Same advertiser, same market, very different outcomes, and the difference sits in how the campaigns were funded.

Why averages mislead when you pick an agency
The typical advertiser's non-brand CPC rose 36% year over year once its own choices were included. The study breaks that down: the market accounted for 22 points, keyword changes brought that down and budget lifted it. The remaining 14 points are unexplained by those three parts, and come mostly from a few advertisers whose CPCs roughly doubled, most likely from category-specific competition a market-wide estimate cannot see.
Spread across advertisers, the picture is wider still. Ten of the 11 advertisers in the index paid more for the same keywords than a year earlier, but actual CPC changes ranged from a 30% decrease to a 121% increase. Keyword and match type changes moved individual advertisers' CPCs by as much as 17% in either direction.
One advertiser kept its budget flat yet saw the same keywords rise 20%; it then paid 40% more overall after moving spend into pricier phrase match keywords. For a single account, its own decisions can matter almost as much as the market.
That is the practical test for shortlisting ppc advertising companies: ask how they separate market movement from account changes on your own data, not only what average CPCs they claim.
The check nobody runs: your own same-keyword comparison
Before accepting a quote, run a comparison on your own account. The steps are simple and the data is already there.
- Export keyword-level cost and clicks for the same non-brand keywords for two matching periods one year apart.
- Leave out broad match keywords and Max Clicks campaigns, for the reasons above.
- Compute CPC per keyword per period, then aggregate with each keyword weighted by its earlier-period clicks.
- Compare that same-keyword figure with the average CPC you actually paid.
- Read the gap as the effect of your own budget, keyword, match type and bid changes.
If the same-keyword figure rose far less than your actual average, your account decisions, not the market, did most of the work. A disciplined agency can show this table before it talks about budget increases; that is the habit to look for when you compare ppc advertising companies.

Alphabet's figure is a different measurement
For context, Alphabet reported that cost-per-click on Google Search & other properties rose 4% year over year in the quarter ended September 30, 2026. That number is often quoted as proof the market is calm.
It measures something else. It is a company-wide revenue per click across all advertisers, geographies and verticals, weighted by whatever mix Alphabet sold that quarter. A B2B advertiser buying the same eighteen non-brand keywords is a different question, and the study answers that narrower one.
Planning a 2027 budget around 20% inflation
A flat budget buys fewer clicks every year. Building roughly 20% annual CPC inflation into a forecast is the minimum before setting growth targets.
The more useful habit is staging. Increase budget in steps and judge each step by the cost of the extra clicks it buys, not by the account's average CPC. The 1.4% per 10% relationship means the second doubling of a budget is not priced like the first.
Then set a ceiling before the spend goes up. On campaigns on automated bidding, decide what an additional conversion is worth and give the strategy a target that matches it. Raising a budget without that decision hands the choice to the algorithm. A sem agency that publishes this staging arithmetic up front is easier to hold to a number later.

What Topkee Media's Performance Google Ads does about it
The point of view here is narrower than "CPC will rise". Topkee Media's Performance Google Ads service is built on the position that advertising should aim at revenue rather than clicks, and it measures the full path from impression through click, landing page, enquiry, proposal and close. When the same click costs more, the efficiency question moves from what a click costs to what it returns. That shift is why the company reads a CPC rise as a question for the funnel rather than a reason to stop spending.
Three documented levers sit under that. The first lever is Quality Score. The company's notes state that relevance of the ad, its keyword and its landing page affects click cost and ad rank, so a high score means lower click costs at the same rank; the workflow keeps those three aligned rather than accepting the auction price. The second is budget and bid discipline: documented methods include refining match types, expanding long-tail terms, refreshing negative keywords, retiring low-performing keywords and moving budget toward higher-converting ad groups.
The third lever is the B2B measurement gap. Platform-native window rules limit how far back conversions can be modelled, and long B2B deals often close outside that window. The TTO Funnel Tuning Agent covers full-cycle funnel analysis so later conversions enter the picture, and its account health scoring includes budget efficiency. One caution from the same notes: Quality Score is not an official KPI or bid signal, and keywords without a visible score can still produce back-end conversions, so the work avoids suspending them on that basis alone.
Recommended next action
If you are writing the 2027 plan now, start with the definition sheet: how to read channel reports, which spend and CPC fields to compare, and what each means before you commit a budget. The SEM Agency Brief: Google Ads Channel Reports 2027 sets out those definitions in one place. Pair it with the same-keyword check above and a review of how AI-assisted Google Ads work lifts conversions before you decide the size of any increase.
FAQ
Is B2B Google Ads really getting more expensive, or is it just my account?
Both, in a measurable proportion. The same keywords cost about 21% more after controls, so the market moved. But your own budget and keyword changes can add as much on top, and moved individual advertisers' CPCs by as much as 17% in either direction.
How much does a bigger budget raise my own CPCs?
About 1.4% for every 10% of additional spend, and roughly 11% for doubling a budget. The effect is consistent with automated bidding entering auctions it previously skipped.
Why is my CPC increase larger than Alphabet's 4%?
Alphabet's figure is revenue per click across all of Google Search, not a same-keyword price for B2B search campaigns. The two measure different populations and should not be compared directly.
How reliable is the 21% figure?
It is a small sample and the study says so: 14 advertisers give a likely range of 1% to 44%. Other methods in the same study land between 17% and 32%, which supports the direction more than the exact size.
Should I budget for 20% annual CPC inflation?
It is a reasonable planning floor rather than a forecast. A flat budget buys fewer clicks each year, and the study's own recommendation is to build roughly that much inflation in before setting growth targets.
Sources
- "Higher Spend Came With Pricier Clicks For 14 B2B Google Advertisers", Search Engine Journal, 15 November 2026. https://www.searchenginejournal.com/b2b-google-ads-keywords-cost-more-agency-data/597426/
- "Same Click, Higher Price: Measuring B2B CPC inflation with first-party Google Ads data", Grey Matter, October 2026. https://gogreymatter.com/research/same-click-higher-price/
- "Alphabet Inc. Form 10-Q for the quarterly period ended September 30, 2026", Alphabet Inc., 29 October 2026. https://s206.q4cdn.com/479360582/files/doc_financials/2026/q3/GOOG-10-Q-Q3-2026.pdf

Article Author
Pang Sir